Each of the infographics in this library illustrates the various data points collected during the Framing the American Dream study. These infographics can be downloaded in pdf or jpeg formats for use on your company website or in PowerPoint presentations, social media posts, email signatures and printed materials. Review the Toolbox Guidance Documents to explore how these images and data can be used to promote specific products or your overall marketing campaign in conjunction with other CM Toolbox materials.
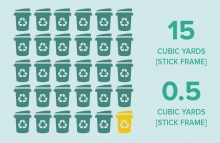
The Framing the American Dream study shows that a stick-framed house creates nearly 30 times more jobsite waste than a component-framed house.
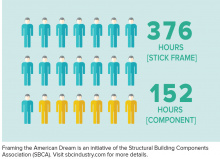
The results of the Framing the American Dream study looked closely at the total number of hours, broken into discreet framing tasks, to determine how long it took a framing crew to complete each home. This infographic makes the person-hour savings of using components clear at a glance.
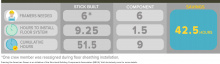
The 2015 Framing the American Dream study was unique in its use of floor panel systems. This infographic looks specifically at the labor savings of installing floor panels versus the floor installation in the stick-built home.
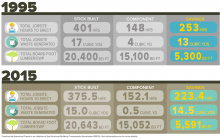
In each Framing the American Dream study, two identical buildings were framed, providing an apples-to-apples comparison of stick and component framing methods. This infographic focuses on what we learned in each area by the numbers.
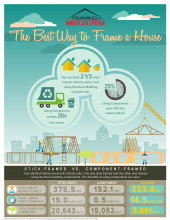
This project overview graphic provides a quick visual representation of the time, labor and waste benefits of using components as well as a more in-depth look into the specific savings in each area based on both the 1995 and 2015 Framing the American Dream studies. This full-page infographic is great to use as a leave-behind with customers or presentation attendees to illustrate the full benefits of framing with components.